AxelSuite
AxelSuite is a set of applications for Navigator project, Centre for Cold Matter, Imperial College, London, UK Axel Suite
Axel Suite is a series of Windows applications providing functionalities for Navigator project (Quantum Accelerometer) at The Centre for Cold Matter, Imperial College London.
The whole suite has been written by Teodor Krastev in C# using WPF framework, Visual Studio 2013 Community Edition IDE and Measurement Studio of National Instruments – visual components and stat/math libraries.
The project is open source, but if you use any piece of it you are required to reference the author and its origin at http://AxelSuite.com.
I’m trying to keep in GitHub only working versions of Axel Suite, but be aware that the project is under active development so some parts of it could be (probably are) underdeveloped.
The principal application controlling the navigator experiment is called MOTMaster2 and it is a part of EDMSuite. More specifically look for navigator branch of EMDSuite project at https://github.com/ColdMatter/EDMSuite/tree/navigator_v0.x
Here are some screenshots of Axel Suite applications accompanied by some brief explanation of their functionality. More details about each of the applications you can find in their respective folder.
Axel Hub
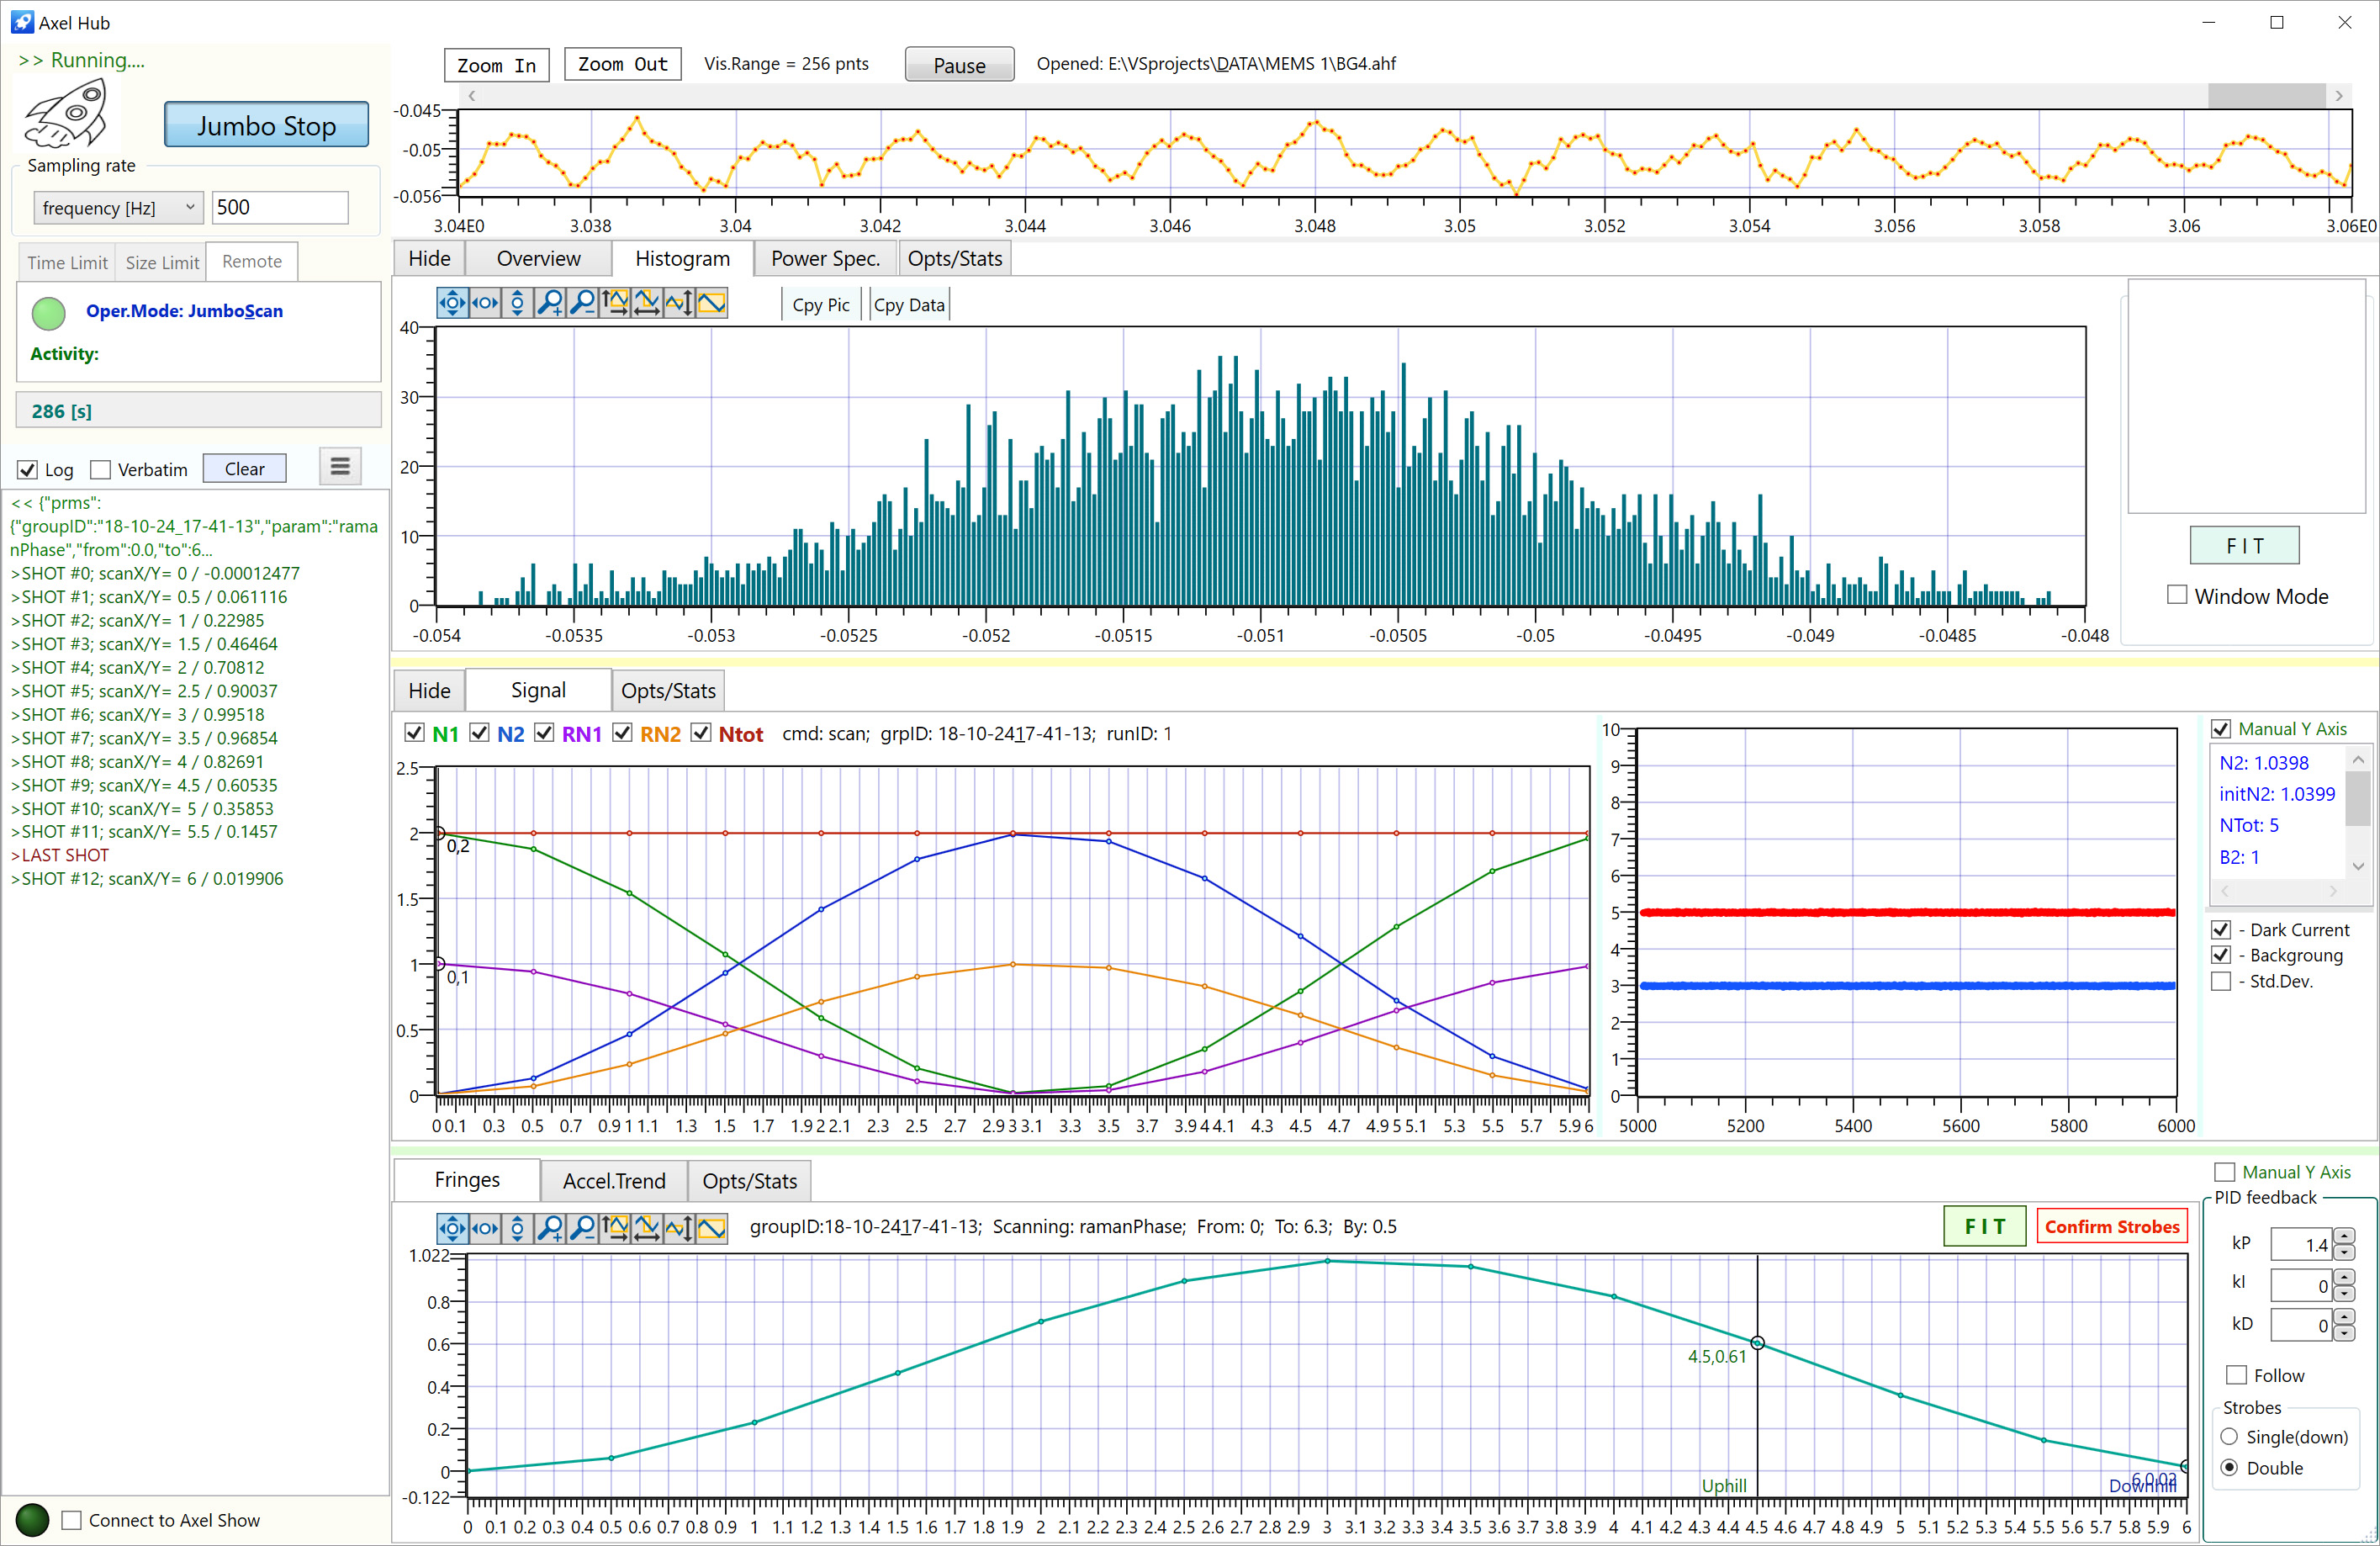
Axel hub is the principal data visualization, logging and processing hub for the quantum accelerometer. It receives raw data from MotMaster2 thru specially designed fast communication channel, visualize the signal (raw data), chart and log its trend. Another major part of Axel Hub is the control of MEMS measurements via 24 bit ADC (NI 9251). The software provides:
- The MEMS (classical) acceleration measurements could be done independently (stay alone) or in synchronization with MotMaster2 data flow. In any case the data can be chart (short term and long term) and histogram or FFT charts could be calculated and drawn in real time. Some tools for off-line data processing are available too.
- The middle panel provides visualization of raw MotMaster2 data (the signal) and some signal trends (N1, N2, Ntot, rel.N1 and rel.N2).
- There are two major operating modes – Simple (Axel Hub is in slave position) and Jumbo (MotMaster2 is in slave position).
- In Simple operation mode the bottom panel is used for charting results - in scan mode: Fringes tab or repeat mode: Accel.Trend tab.
- Another major feature is so called Jumbo mode, in this mode MotMaster2 is under Axel hub control providing first fringes pattern (scan of Raman phase) and then using PID algorithm following a chosen fringe position (pi-flip procedure) in order to calculated the quantum acceleration.
- Finally, the quantum and the classical acceleration measurements are combined in one result acceleration value. All the accelerations are presented in a chart (Acce.Trend) and in a table.
- Optionally some of the intermediate results can be logged for later adjusting the processing parameters.
Axel Probe
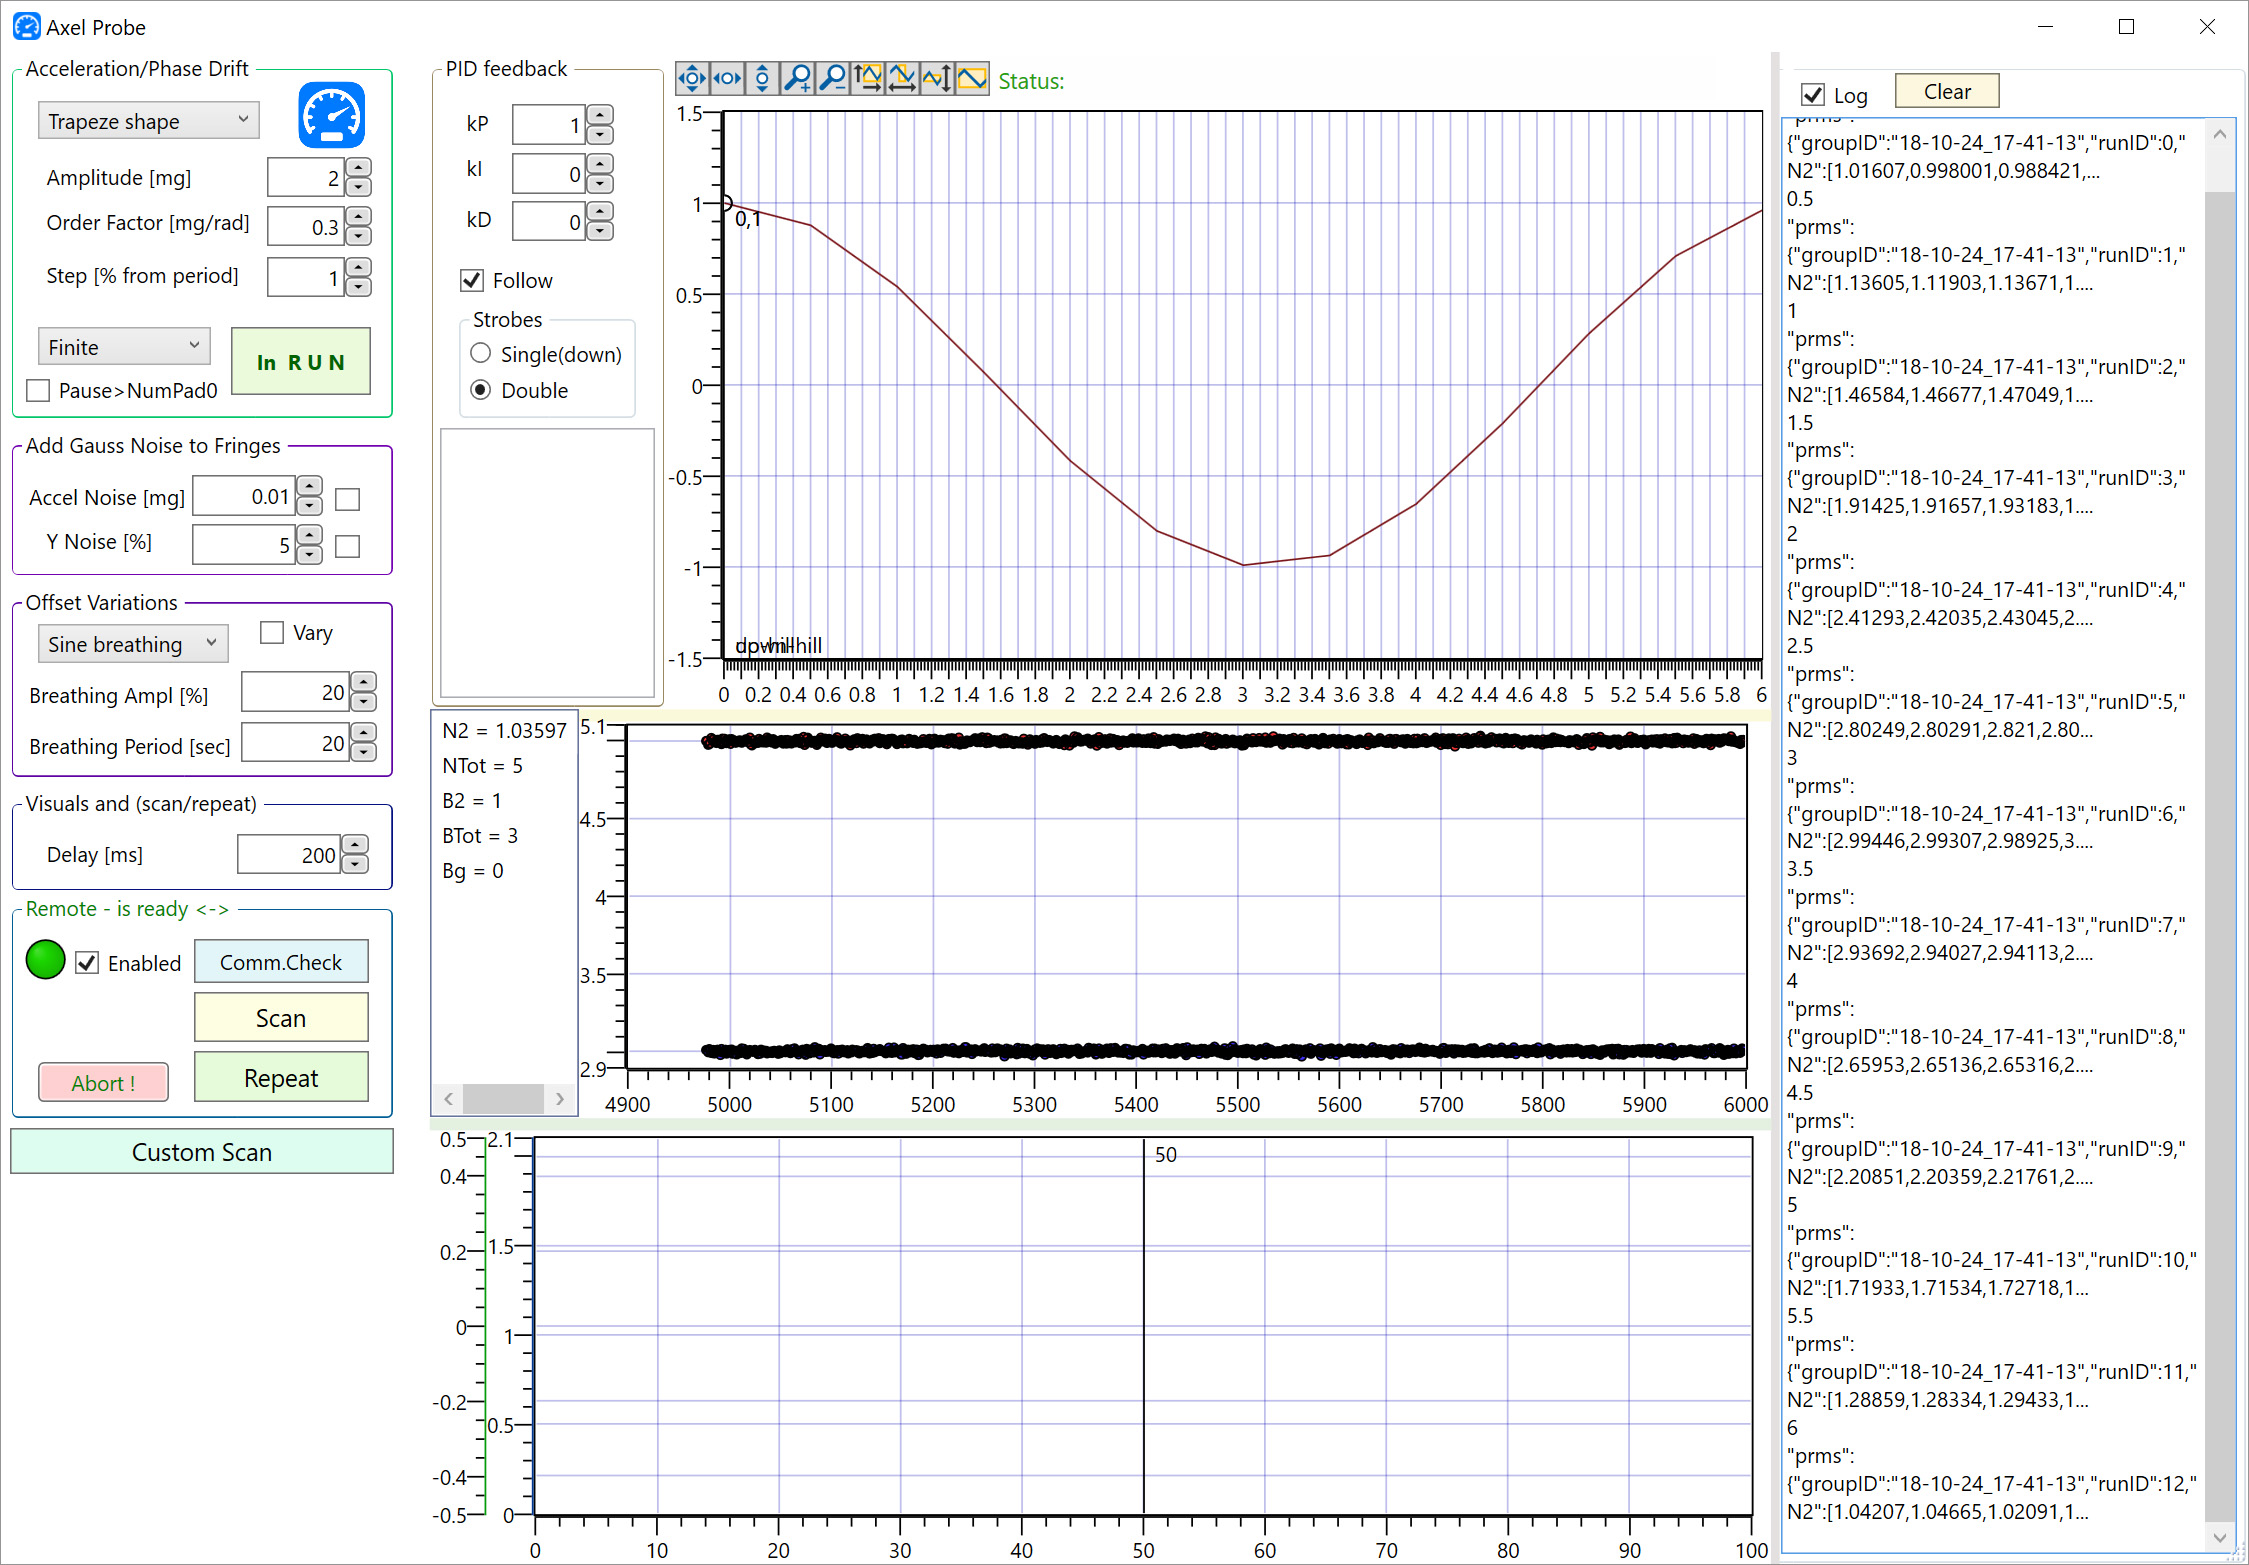
Axel Probe is designed as simulator of MotMaster2 application including the quantum (MOT) accelerometer. The main purpose is to test Axel Hub for communication, logging, visualizing and data processing abilities. The software provides:
- The simulation starts with generation of an acceleration pattern (repeatable). Then Axel Probe would simulate a signal which would come out of MotMaster2 and the MOT experiment and send that signal to Axel Hub
- A number behavioural patterns are available, as well as adding Gaussian noise and variety of simulated signal disturbances as amplitude variation, etc.
- In case of active feedback of Raman phase in order to follow the position of a fringe (from the atomic interferometer), Axel Probe will take into account the fed back Raman phase when the signal is simulated. For example - the PID algorithm (with pi-flip) could be tested and optimized that way.
- Most of the intermediate and resulting value of calculation (simulation) are visible in charts and some of them in the communication log.
Axel Tilt
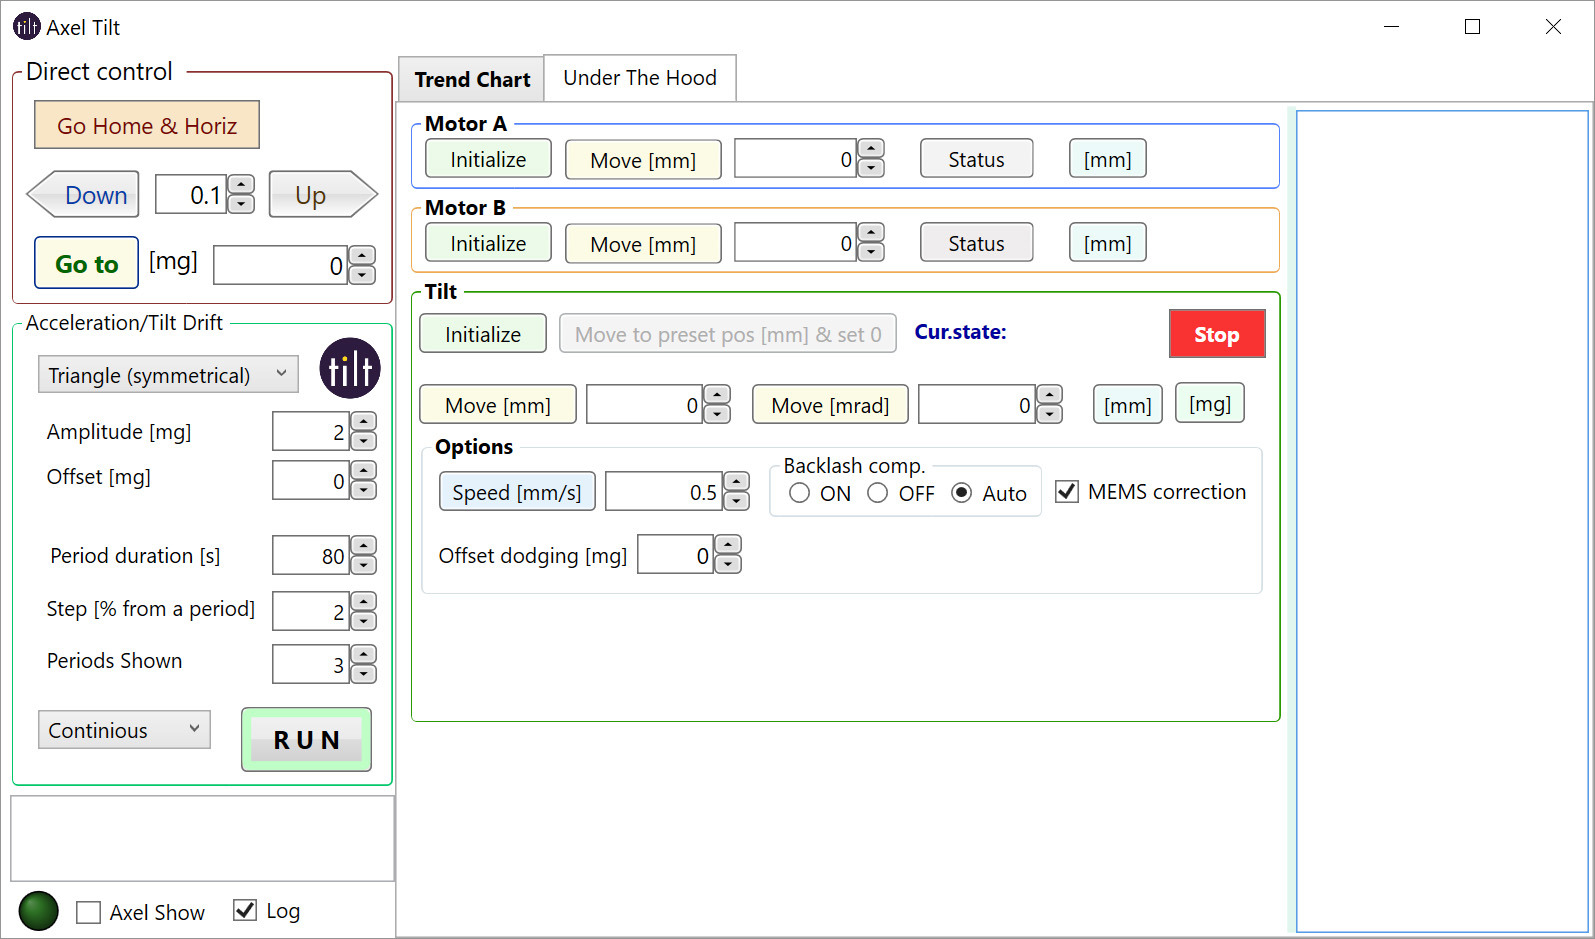
Axel Tilt is an application to control the tilt of a platform the navigator experiment sits on. Tilting the platform simulates acceleration of the experiment by using a component of earth acceleration – the resulting acceleration is proportional to the angle of the tilt. The actual mechanical control is implemented via two step-motors with micro-steps moving one side of the platform up and down. The software provides:
- Means to adjust initial horizontal orientation of the platform, which is saved and retrieved after start.
- Tilting manually the platform to a target tilt/acceleration or gradually.
- Tilting the platform following pre-programmed patterns of behaviour in repeated manner.
- The application can be connected to another application Axel Show in order to report its current position on demand
Axel Show
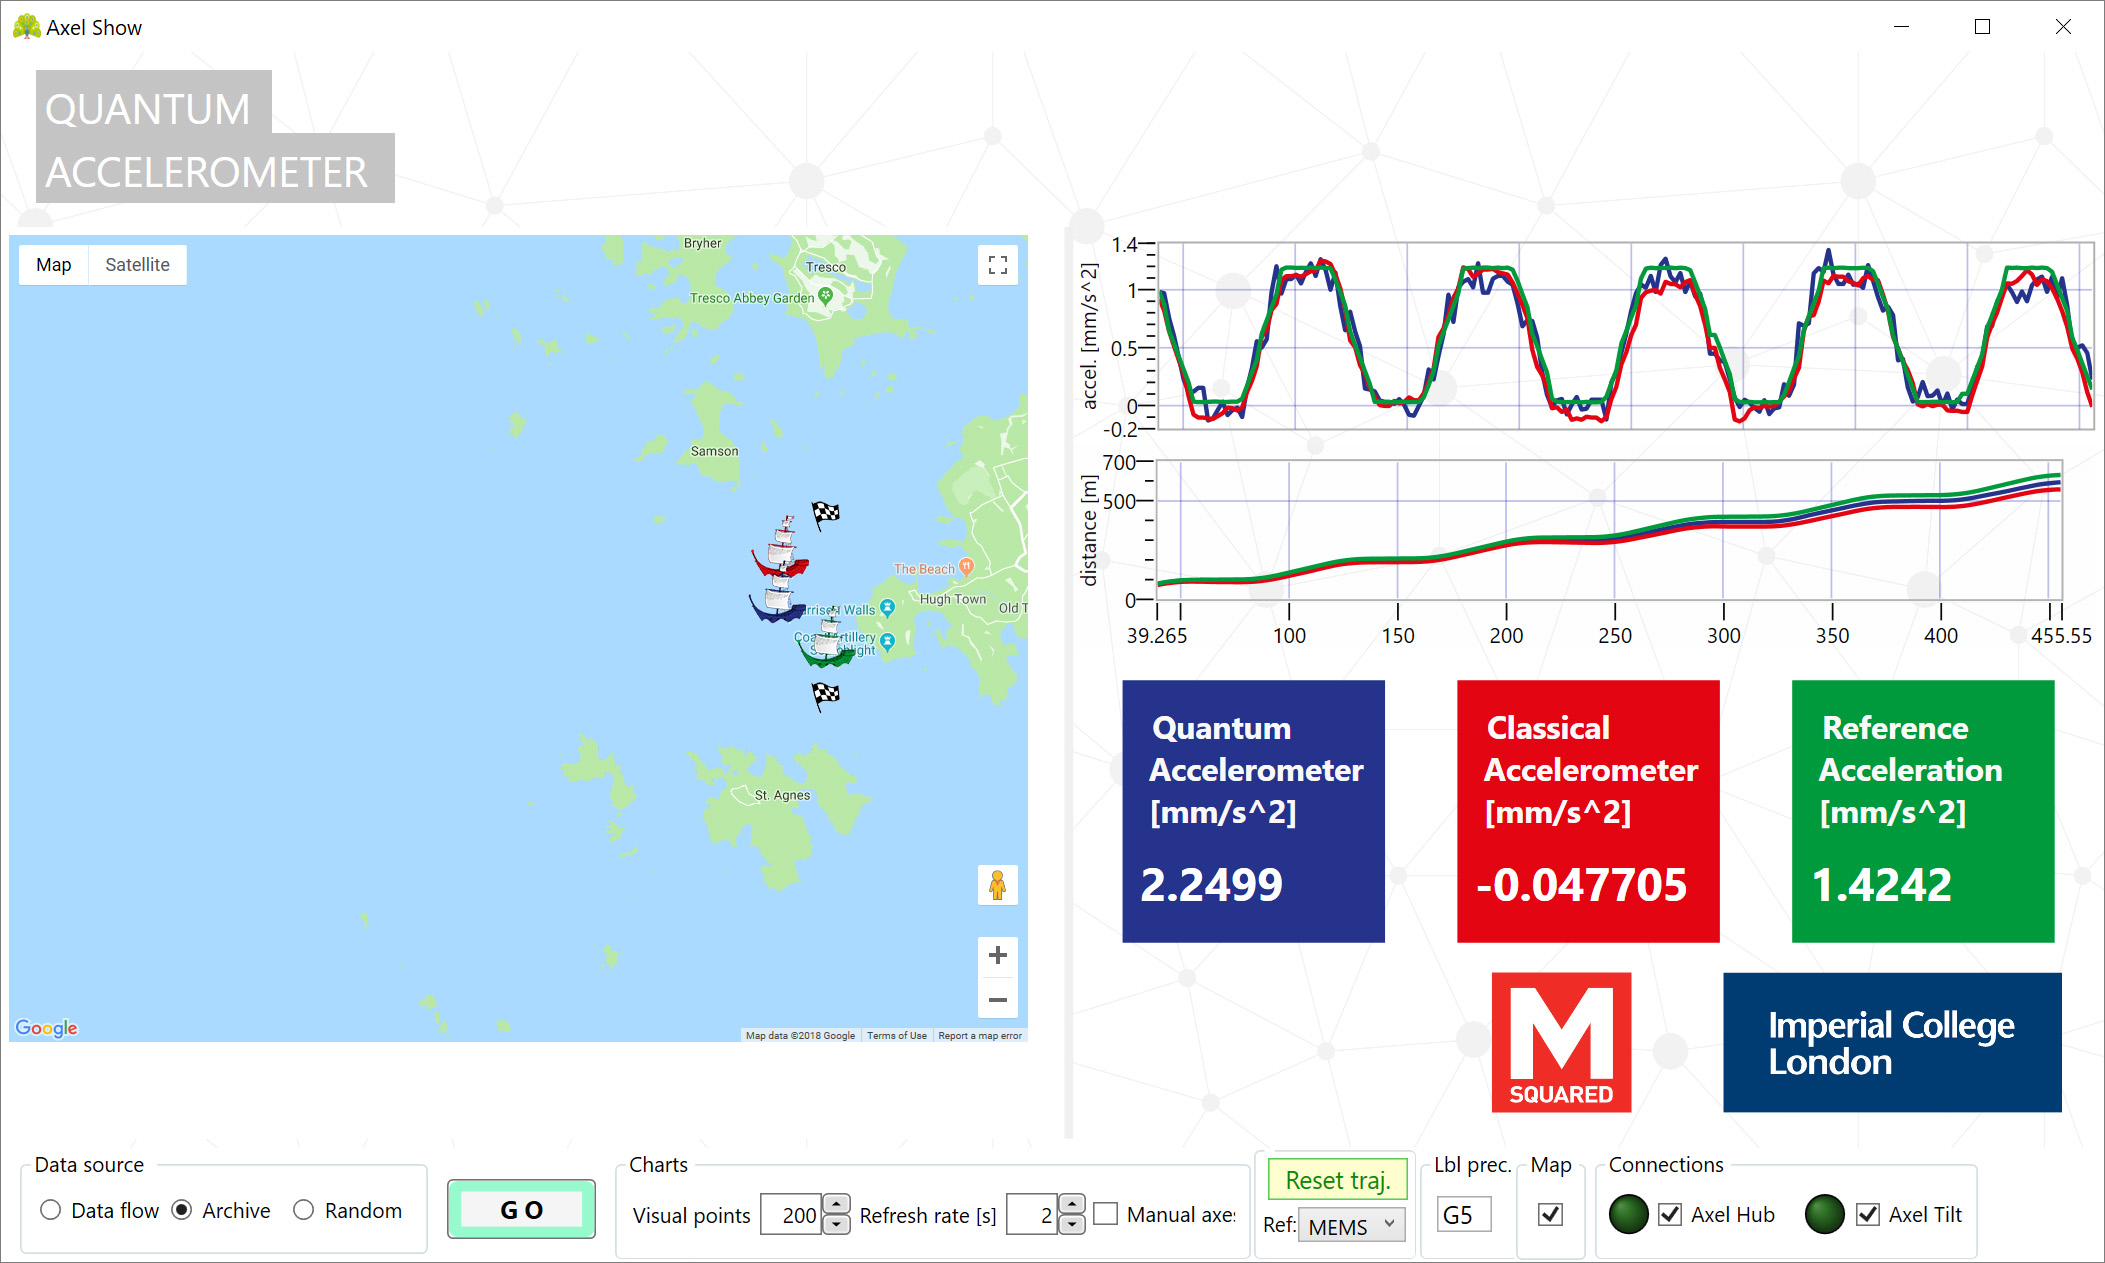
Axel Show is an application to demonstrate the capabilities of the navigator (quantum accelerometer) by combining information from different acceleration sources, calculating the distances following these accelerations and show accelerations, distances and position on a map according the distances. The software provides:
- Connections to Axel Hub and Axel Tilt, first to collect acceleration measurements from atomic interferometer and classical (MEMS) accelerometer and second – the request the status the current tilt of the platform.
- Create a log file of all the measurements in order to examine the data on later day.
- Chart the accelerations and distances; showing the values of the last acceleration point.
- Optionally visualize the distances on Google Map as icons of boats with corresponding geographical longitude and latitude.